This blog is for myself and all others who want to learn about financial investment in general. While the focus of blog is on stocks, I would also like to cover: bond, derivative (options, swaps, future and forward), fund, currency, commodity, Treasury bill (risk-free)/bond, speculation, hedge, black-scholes
Friday, September 17, 2010
THE CAPM AND INDEX MODELS
Estimating the Index Model
Using historical data on T-bills, S&P 500 and individual securities
Regress risk premiums for individual stocks against the risk premiums for the S&P 500
Slope is the beta for the individual stock
Table 7.1 Monthly Return Statistics for T-bills, S&P 500 and General Motors
Figure 7.3 Cumulative Returns for T-bills, S&P 500 and GM Stock
Figure 7.4 Characteristic Line for GM
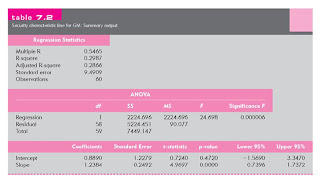
Table 7.2 Security Characteristic Line for GM: Summary Output
GM Regression: What We Can Learn
GM is a cyclical stock
Required Return:
rf + b(rm - rf) = 2.75 + 1.24x5.5 = 9.57%
Next compute betas of other firms in the industry
Predicting Betas
The beta from the regression equation is an estimate based on past history
Betas exhibit a statistical property
Regression toward the mean
Subscribe to:
Post Comments (Atom)


Thanks for explaining this concept!
ReplyDeleteShares to Buy