APR = annual percentage rate
(periods in year) X (rate for period)
EAR = effective annual rate
( 1+ rate for period)^Periods per yr - 1
Example: monthly return of 1%
APR = 1% X 12 = 12%
EAR = (1.01)^12 - 1 = 12.68%
Tuesday, August 31, 2010
Dollar weighted returns
Here are some characteristics of dollar weighted returns.
-It considers changes in investment
-Initial Investment is an outflow (money going out from your pocket)
-Ending value is considered as an inflow (money coming into your pocket)
-Additional investment is a negative flow (Again, money leaving your pocket)
-Reduced investment is a positive flow (Again, money coming back to your pocket)
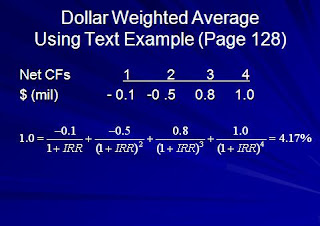
Dollar weighted return is nothing more than a IRR.
Internal Rate of Return (IRR) is the discount rate that results in present value of the future cash flows being equal to the investment amount.
Example
When you compute the IRR, this is the rate of return at which the net present value of project/investment is zero. In other words, if the internal rate of return exceeds the cost of financing the project, then the investment is profitable.
We can also approach it from NPV perspective.
NPV = Sum of CFt/ (1+ Rt)^t from period t=0 to n.
Whereas NPV = Net present value and CFt = Cash flow at time t.
When the rate of return is smaller than the IRR rate Rt then the investment is profitable (meaning NPV > 0 ). Otherwise, investment is not profitable.
IRR can also be a good measurement when considering multiple investment with a limited budget.
So if you have two different stocks in mind but only have a few hundred bucks then you would compute IRR and see which one has higher IRR.
However, there are some limitations with dollar weighted returns.
If cash flow changes from positive to negative or from negative to positive, IRR for investment cannot be calculated. Additionally, when you use IRR to evaluate multiple investment, result might indicate different ranking than NPV.
For instance NPVa = 50 and NPVb = 100 but IRRa = 5 % and IRRb = 3.6 %
In this case, NPV indicate that investment b is more profitable but IRR says a is better.
Which one should you choose?
If NPV and IRR give different result then NPV always rules over IRR. So investment b is superior.
This is because of IRR's weaknesses. First IRR uses single discount rate failing to accommodate changes in the rate. Second, IRR sometimes cannot be computed with mixture of positive and negative cash flow. And lastly, discount rate is sometimes unknown. You compare IRR to discount rate and then proceed to make an investment if IRR> discount rate. But if discount rate is unknown or cannot be applied for whatever reason then IRR does not work. On the other hand, NPV is inherently complex and requires assumption at each stage. If NPV > 0 then we know investment is worthwhile. This is why NPV is superior than IRR.
-It considers changes in investment
-Initial Investment is an outflow (money going out from your pocket)
-Ending value is considered as an inflow (money coming into your pocket)
-Additional investment is a negative flow (Again, money leaving your pocket)
-Reduced investment is a positive flow (Again, money coming back to your pocket)
Dollar weighted return is nothing more than a IRR.
Internal Rate of Return (IRR) is the discount rate that results in present value of the future cash flows being equal to the investment amount.
Example

When you compute the IRR, this is the rate of return at which the net present value of project/investment is zero. In other words, if the internal rate of return exceeds the cost of financing the project, then the investment is profitable.
We can also approach it from NPV perspective.
NPV = Sum of CFt/ (1+ Rt)^t from period t=0 to n.
Whereas NPV = Net present value and CFt = Cash flow at time t.
When the rate of return is smaller than the IRR rate Rt then the investment is profitable (meaning NPV > 0 ). Otherwise, investment is not profitable.
IRR can also be a good measurement when considering multiple investment with a limited budget.
So if you have two different stocks in mind but only have a few hundred bucks then you would compute IRR and see which one has higher IRR.
However, there are some limitations with dollar weighted returns.
If cash flow changes from positive to negative or from negative to positive, IRR for investment cannot be calculated. Additionally, when you use IRR to evaluate multiple investment, result might indicate different ranking than NPV.
For instance NPVa = 50 and NPVb = 100 but IRRa = 5 % and IRRb = 3.6 %
In this case, NPV indicate that investment b is more profitable but IRR says a is better.
Which one should you choose?
If NPV and IRR give different result then NPV always rules over IRR. So investment b is superior.
This is because of IRR's weaknesses. First IRR uses single discount rate failing to accommodate changes in the rate. Second, IRR sometimes cannot be computed with mixture of positive and negative cash flow. And lastly, discount rate is sometimes unknown. You compare IRR to discount rate and then proceed to make an investment if IRR> discount rate. But if discount rate is unknown or cannot be applied for whatever reason then IRR does not work. On the other hand, NPV is inherently complex and requires assumption at each stage. If NPV > 0 then we know investment is worthwhile. This is why NPV is superior than IRR.
Returns using arithmetic and geometric average
Arithmetic
rA = (r1 + r2 + r3 + ...rN) / N
rA = Arithmetic return
r1 = return 1, r2 = return 2, rN = return N, N = total number of returns
Example
rA = ( .10 + .25 - .20 + .25) / 4 = .10 or 10 %
Geometric
rg = {[(1+r1) (1+r2) .... (1+rn)]}^ 1/n - 1
Example
rg = {[(1.1) (1.25) (.8) (1.25)]}^ 1/4 - 1
= (1.5150) 1/4 -1 = .0829 = 8.29%
Note that arithmetic average works better when each number is independent whereas geometric is a better choice if numbers are dependent to each other.
For instance, lets say you are trying to calculate average for annual stock returns over fiver year period. Each year's stock return is not independent of past year's performance. If you incur loss in one year then you have less capital to generate return following year. For this reason, geometric average may give more accurate performance of your portfolio.
Sunday, August 29, 2010
Risk and returns
We all know that risk and return have a direct relationship. If you want a bigger return then you must be willing to take additional risks that come along with it.
Let us see how to compute rate of return.
Holding period return for stock
HPR = (P1-P0+D1) / P0
Whereas P0=beginning price, P1= ending price, D1 = dividend
This return shows what % you earned during the stock holding period.
Example
Ending price = 24
Beginning price = 20
Dividend = 1
HPR = (24-20+1) / 20 = 25%
This is for a single period. In contrast when you want to measure return over multiple periods, you may need to measure how your investment performed over a preceding five-year period. Note that return measure is more ambiguous in this case.
Here's the example of multiple period return.

Tuesday, August 24, 2010
Leverage
In finance, leverage is any technique that is used to multiply gain or loss. Common usage of leverage is borrowing money to finance investment. For instance, let us say you bought 100 shares of stock A trading at $10. Total investment value is $1000. If the stock price increases from $10 to $15 then you have total investment value of $1500. So HPR would be (1500-1000)/1000 = .5 or 50 %. Now if you leverage your investment by borrowing money from your broker, return would be different. Let us say you borrow $1000 from Schwab and buy additional 100 shares at the same price $10 then you have total investment worth $2000. Again the stock price rises from $10 to $15. Here your total investment value becomes $3000. Subtract the borrowed fund $1000, which you will have to repay. Then you have final value of $2000. Your HPR would be (2000-1000)/1000 = 1 or 100 %. By borrowing half of your investment fund, you just doubled your return.
Case 1
100 shares at $10 = $1000 total
If stock price increases from $10 to $15
HPR = ($1500 - 1000)/ 1000 = .5 or 50 %
Case 2
100 shares at $10 = $1000
Additional 100 shares at $10 = $1000 ->borrowed fund from Schwab
Total investment value = $2000
If stock price increases from $10 to $15
HPR = ($3000 - 1000 - 1000) / 1000 = 1 or 100%
It is very important to acknowledge that leverage also works the same way in negative return. So that means if a half of your investment is leveraged then your profit or loss will be doubled. If stock price in the above declined from $10 to 5 then would have -50% return in the first case and -100% return in the second case.
Note that margin rate (interest you need to pay for borrowing fund) is not included in the calculation.
Leverage can be an excellent way to boost your return while it imposes a significant amount of risk. Shrewd investors must be careful using leverage and be willing to accept the risk that comes along.
Monday, August 23, 2010
Gary Pilgrim
Gary Pilgrim is the manager of PBHG Growth, one of the top performing mutual funds. In similarity with O'Neil, he is a dynamic growth investor who puts lots of emphasis on earning momentum.
In order to avoid emotion affecting his buy/sell decision, he automates the process via using computer ranking system. First, system looks for the stocks that have increased their earnings by 20 % or more for two consecutive quarters. And then the system analyze if a stock has an upward earning estimate and positive earning surprise. Pilgrim is a number cruncher and barely visit his holding companies or have a meeting with the management team. His objective is to know how the companies are doing as opposed to what they are doing.
Pilgrim looks for high earning expectations and positive earning surprises. In other words, he likes company that analyst expect its earning to increase and have performed ever better than the expectation in past. Also, earning itself is not as meaning unless it has been growing over a period of time. Pilgrim looks at the rate of acceleration to figure out how rapidly company's earning has been growing. He wants to see a company's quarter earning greater than the earning from same quarter from a previous year.
In addition, Pilgrim pays a close attention to company balance sheet. In order to evaluate how company is managing its money, Pilgrim uses the BS as a reference and see if a company has what % of profit margin and $ value of debts.
Surprisingly, valuation models have no roles in Pilgrim's investment. Pilgrim mentions that P/E of 40 does not mean anything unless you look at the underlying growth characteristic of the stock. For instance, if a company has P/E of 20 but its earning growth rate is 25% then the stock is trading at a discount. He focuses entirely on growth factors when buying/selling stocks. Here, Pilgrim's view point of stock value equals to the expected value of net income. So it would something like S = E(NI). In contrary with O'Neil who stops loss at 8%, Pilgrim actually buys more of its stocks if its price decline but earning factors remain same. Ironically, that side of Pilgrim is somewhat similar to value investors because he withstand market volatility if he believes that stock is fundamentally undervalued.
Pilgrim once mentioned that growth investing may not be a good option for individual investors. That is, market fluctuate every second and so does the expected earning growth rates of companies. Professional analysts have thousands of $ worth access to information and they can keep the track of price movement and earning related news instantaneously. Whereas, individual investors have limited sources and it is a very time+effort consuming job. Pilgrim believes that investment success or failure submits to your own personal conviction and work habits. Because one method works for Pilgrim, it does not mean that very method will work for you. On the other had, there are a plenty of value investors who made successful investments while Pilgrim insists on growth investing. Hence, you must develop an investment strategies that best fit your objective and styles, which will reflect your believe and value system.
Sunday, August 22, 2010
How to make money in stocks
Willieam O'Neil is the founder of Invester Business Daily, which is a major competitor of the Wall STreet Journal. He also wrote a book called "How to make money in stocks," which represents his knowledge about growth investing. O'Neil has a sounding system/standard that he uses to screen out the stocks that meets his requirement. This system is known as CAN SLIM. It is an acronym for the attributes of companies/stocks that he considers to be investable. O'Neil emphasizes that a company must have all seven attributes in order to be considered for investment.
C: Current quarterly earnings per share must be accelerating. When comparied to the same quarter from previous year, O'Neil wants to see increase in the current quarterly EPS. Bigger is always better. However, you must be careful not to be misled by a huge jump. For instance, a company's quarter EPS might have increased from $.01 to $.10, which is 900% increase but it is no better than increase from $.50 to $1 because the former is most likley to be distored and thus as not meaningful as the latter.
A: Annual EPS must be accerlating. Similar to "C", O'Neil wants to see each year's EPS increasing for the past five years. Preferably, the growth rate should be at least 25%.
N: New highs/something. O'Neil likes companies that have new products, services, management, or something that is postively contributing to the company. But more importantly, he likes stocks that are pushing to new highs. In here, we are talking about 52 weeks new high. Past 52 weeks, stock could've hit the low of $5 and high of $25. At the time when O'Neil buys the stock, the stock should be pushing to new high of $26.
S: Demand of stock should be greather than its supply. Supply and demand affect the price of everything including stocks. All other things being equal, stock with 50M shares oustanding is a better pick than a stock with 100M shares oustanding. You can compare to trading volume of stock and the number of shares outstanding to figure out the stock's supply and demand.
L: Leaders in an industry, AKA best relative price strength. Investor's Business Daily shows the relative price strength of stock, ranging from 1 to 99. Here if number is bigger, stock's performance is stronger so that means higher relarive price strength stock outperformed lower numbered stocks.
I: Institutional ownership must be moderate. As mentioned, demand is needed to drive stock price up. Institutional buying is one of the best source to measure stock's demand. Mutual funds, pention plan, banks and insurance companies are all institutional investors. O'Neil wants his stock to be owned by moderated number of institutions. If it's too small, that means demand is weak. That is not much of a problem. Perhaps, stock is undiscoverd yet and it has an opportunity to attract instituion and price will rocket soar. But on the other hand if stock is heavily owned by institutions then it may be over demanded. Moreover, if all the instituions reacts in the same way to negative news, they can dump a large number of shares and its price will plummet.
M: Market direction should be upward/positive. Even if you the greatest stock of all time, its price will probably decline if the market as a whore is doing poorly. Your stock might get back to its intrinsic value once market starts to recover but O'Neil is strictly a growth investor. In order to see the direction of market, O'Neil recommends watching the market average everyday. You can do so by following the daily price and volume of DJIA, SP500, NASDAQ and what not.
O'Neil believe in growth investing and completely ignores valuation models. He mentioned that cheap stocks are cheap for reasons and you get what you pay for. He basically does not care about P/E ratio. To him, relation between earning and price are irrelevant and should focus on earning acceleration itself. In addition, he believe in law of motion. This does not have anything to do with physics. N of CAN SLIM represents new highs of stock. He said, "What seems too high and risky usually goes higher and what seems low and cheaper usually goes lower." His firm's research back up his idea. According to it, stocks on the new high list tend to go higher while stocks on the new low list tend to go lower. Besides the stock price, O'Neil aggrees with Lynch that insider ownership and little debts are postive sign of stock.
Average down Vs. Retail Investment
O'Neil argues that investors should manage their portfolio as if they were managing retail store. On the shelf you have item A and B, if A sells better than B then what should you do? Obviously, put more As and get rid of Bs. This is retail investment: you buy more of what is working and sell off worse performers. In contrary, some investors do exactly opposite. They sell the better performers and add money to stocks that have fallen in price. This is not necessarily wrong. If you are very sure that your stock is undervalued and its price will drive back to the intrinsic value, you are buying the additional shares at a discount. But if your analysis is off by few dollars or so, you could be wasting substantial amount of money buying losers while your better performers are rocket soaring.
Automation of buying and selling
O'Neil likes to automate his transaction. By doing so, you are protected from emotional decisions. O'Neil places stop losses on his stocks, usually at 8%. Note that the stop losses should be applied to the new money invested in. For instance, if you initially bought 100 shares of stock at $10 then your total investment is $1000. It has risen 50% and then falls back to 40%. This necessarily may not be time to stop losses. Let us say that you add more money into it while the price is rising, O'Neil recommends stopping losses on that money if the stock slides back while keeping your inial investment money in the stock. So your stop threshold for the initial investment would be $9.2 while new stop loss for additional investment would be $13.8. O'Neil is an advocate of averaing up, also known as pyramiding. The plan is to move more moreny into your winners. O'Neil said, "Your objective in the market is not to be right but to make big money when you were right." This is simple but a powerful statement. When one of your stock picks declines and you sell it off because it hit the stop loss, you may not be valuing it correctly. The stock could be truly undervalued and its price may go up in the future. But what O'Neil is aruguing is that your job is to make profits based on your analysis as well as by responding/adapting quickly to the market. Here are some main points of O'Neil
1. Buy exactly at the pivot point where a stock is climbing up to new high after a flat area in an upward direction.
2. Put the stop losses at 8%.
3.If stock increase, put more capital into it up to 5% past the inital buy point. For instance you bought a share of stock at $100. It has risen to $102 then you would put more money into it but when it reaches $105 then you should stop putting more money.
4.Once stock has risen 20%, sell it.
5.If a stock rises 20% in less than 8 weeks, hold it at least another 8 weeks. After that time period, make a decision to buy more or sell based on analysis and current price.
6. Focused portfolio. Concentrate on few winners than to have many small profits.
7.Make grudual move into and out of a stock. Buy a parcel of stock when it starts to rise and buy additional shares when it even goes furter. Opposite is true also. When your stock starts to decline, sell a parcel of it and completely get rid of it when the loss hits 8%.
8. Once bought, ignore the price you paid for each stock and cocentrate on each stock's performance.
9. Do not base your sell decision on your cost and hold the stocks that are down in price. Accept the fact you have made an imprudent selection and lost money.
Friday, August 20, 2010
One up on Wall Street
Peter Lynch is an author of "One up on wall street." But he is more well known as a former manager of the Fidelity Magellan Fund, which was the world's largest mutual fund. During his tenure, Magellan outperformed 99 % of all stock funds growing from $20 million to $14 billion. One of the core strategies of his investment is "circle of competence." He insists to know the nature of business as well as industry before he makes an investment. There are a plenty of sources to get information. You can talk to employees, competitors, suppliers, etc. More importantly, you as a consumer have a pretty good idea of what products/services are superior than the others. Lynch found Taco Bell by eating a burrito on a trip to California. He found La Quinta by talking to people at the rival Holiday Inn. He found apple computer when his children insisted on owning one. As simple as it might look, a good investment could be nothing more than a good buy at Walmart.
Once he finds the company he wishes to invest in, Lynch likes to organize his picks into 6 different categories, which are
1. Slow grower
2. Stalwarts
3. Cyclicals
4. Fast grower
5. Turnaround
6. Asset plays
Here's the explanations for each.
1. Slow growers are usually large in size and older companies that used to be small but matured and have stable performance. Example would be utility companies like AT&T, Verizon, National grids. Their capital appreciation would not be much. In fact, it could move downward but they usually pay good dividends.
2. Stalwarts are large and old but they have not matured yet and are still growing. In 1988, Warren Buffer allocated $1 billion to invest in Coca-Cola. By that time, Coca-Cola was well established company and its stock price has risen fivefold in 6 years. In fact, it had risen over 500 folds since 1928. Many investors thought it was over priced and had no more spaces to grow. Yet its business expanded internationally finding new markets and successfully set its position as a global king of beverage. In this case, Coca-Cola is a classic example of Stalwarts.
3. Cyclicals are companies that are heavily affected by economy. If economy does well, so does the company, vice versa.
4. Fast growers are small young companies that grew at least 20% or more a year and have potential to become ever bigger. This is where a massive fortune or risks can be found. Although they are no longer fast growers, Starbucks, Iomega and the Gap were all fast growers who returned massive fortune to founding-investor who provided initial capital.
5. Turnarounds are internally good, solid companies that have been beaten down by external factors/markets. In the early 80s, Lynch bought Chrysler at $1.50 and it became 32 beggers.
6. Asset plays are companies with valuable resources that are not discovered by investors. Pebble beach in California and Alico in Florida owned valuable real estates that no investors paid attention. Later on, those real estate value rocket soared. Another example would be telecommunication companies 20-30 years ago. Asset plays are most likely to be new tech companies, who have intelligent ideas/product that have potential to be an industry leader.
Note that Lynch's classification is to know what you are buying. To set out to buy a stalwart or actively looking for fast grower might be very difficult. Once you make a decision to make an investment, use those categories to know nature of a company and know your expectation. If the stock you are buying is turnaround, you know that its stock is undervalued and you should not be concerned with market fluctuation because your expectation is that market will realize the intrincsic value of the company and will bring its price back to what it should be.
Lynch points out several compenents of a good company. First, simple business is better. Lynch emphasizes an importance of understanding the business before making an investment. If you own 10 different stocks in your portfolio and 9 out 10 have complex nature such medical related, bio-tech or computer engineering, you probably don't have in-depth knowledge about the business and industry. Knowing your company and industry vital to investment success.
In addition, Lynch likes companies that are overlooked by others. Everyone likes fancy, flash companies with new tech but then again all the bubbles busted in the early 2000s. Seven Oaks International is one of the most boring businesses you will ever find. It processes grocery store coupons. While everyone else is looking for new high tech companies, Lynch invested in Seven Oaks and its stock price rose from $4 to $33, impressive retrn of 725%. Think about Waste management, as the name implies the company manages waste which is a bit digusting to some investors. This company turned out to be 100 bagger.
Fast-growing companies are best inside slow growth industry if not no growth at all. This is no brainer. If your company is the one and only, who is rapidly growing while competitors are off the market then it is an obvious advantage. Such growth comes from having a niche. That niche can be anything from a quality product/services to excellent management. But one common characteristic that all niches share is its uniqueness. To have patents, trademarks, strong brand loyalty, companies have valuable niches that competitors do not and it drives the growth of company along with the increase in sales and profit.
Lych, like other investment masters, have his own way of protection against stock. He computes his margin of safety by subtracting cash per share from stock's current price. In 1988, Ford's stock was trading at $38 and its cash per share was $16.30. This means his margin of safety is 38-16.30, which is 21.70. Until the stock price goes down to $21.70, you can withstand the loss because you bought your stock at a discount. Also, Lynch points out importance of having a little debt. Long term debts are like deadly. It is overlooked in good time but when situation turns around, those debt strick the company hard.
Lynch recommends valuing stock price relative to company's value. In more detail, Lynch likes his stock P/E ratio equal to its earning growth rate. If a company's P/E 20 then he wants to see earning growth rate of 20%. If the growth rate is greather than the P/E then you have a bargain.
One other thing that Lynch mentions is insider/company buying the shares. Insiders such as employees and executives are the ones who are most knowledgable about the company. If they are buying shares, then you know at least the company won't go bankruptcy in next 6 months. Plus, those who buy stocks are partial owner of the company and they will likely to put more effort in their works because performance of company is directly related to their welfare. Note that while insidering buying is a good sign, insiders selling their stocks is not necessarily a bad sign. There are many reasons to sell stocks. Stock is an investment but before that, it is nothing more than a part of your property. If you wishes to buy a new car, have some expenses coming up for your college kids, or planning an exotic vacation, you can always sell your stock to get quick cash. But then again, there is only one reason buy stock: you expect it to go up.
One top of that, company buying its shares back can be seen a positive sign. If it is expecting a better performance in the future and have a plenty of cansh in its hand, it actually might be a good investment to buy its shares back. Note that those companies listed on stock market are legal entites. They are quite different from sole proprieties, partnerships and LLCs. They are separate legal entities from owners and can sometimes act as an individual investor. When a company buys its shares back, all things being equal, there are less number of shares outstanding for general public. A shortage in supply will cause the stock price to increase. Also, decrease in shares outstanding means increase in EPS. If a company buys back half of its shares while earning reamins the same then EPS just doubled.
Lastly, Lynch advises investors to know why he/she is buying the stock. He calls it the 2 minutes drill. Before buying a stock, you give 2 minute speech that covers the reason why he's interested in the stock, what should happen to succeed and pitalfall standing in its path. In this case when price stock goes up or down, you can look back and rely on those reasons to make a new decision. Say you bought your stock because sales have increased 15% past 3 years and net income increased 10 % annually on the average past 5 years. That is the reason why you bought the stock. After the purchase, stock price declines by 10% and there are no changes in sales or net income. Should you sell the stock? probably not. If a company reports quarter income statement and both sales and net income declined by 20%. Due to that stock price declined by 30%, should you sell the stock? maybe. Wheter to hold it or sell it off because it violated the reasons for your purchase is up to you. The point here is that your decision to buy/sell stock should not be solely based on stock movement.
.
Tuesday, August 17, 2010
Common sstocks and uncommon profits
Philip Fisher is the author of "Common stock and uncommon profits" and he is considered to be a father of growth investing. Warren buffet once mentioned he is 15 % Fisher and 85 % Graham. One of the simple but strong argument that Fisher makes is that investors should buy stocks/businesses that have been growing in sales and net income. Preferably, the sales and net income must be growing over a period of years and at rates greater than industry average. This means investor should buy a new shinning star of the industry. In here, you are looking at both absolute and relative value of a company. The growth of sales and net income is one measure to look at absolute value of a company. This way, you see how fast the company is growing at xyz rate. On the other hand, you also need to pay attention its competitors and evaluate the company in relation to other players in the industry.
Fisher puts a great emphasis on sales. After all, research & development would be fruitless if a company has greatest tech product ever made but can't sell it to customers. One of the prime example companies would be Microsoft. Microsoft is well known sales machine. Some industry experts argue that Microsoft does not develop superior products than its competitors to the extend, where market is dominated by a single company. In fact, some argue that Microsoft merely copies competitors' product and muscle out the market with its capital. However, that does not change the fact that MS is the most dominant player in the market and has been performing excellent.
The other factor that must be considered is profit. As mentioned in the previous post, sales and profits are not mutually exclusive. More than often, they go along together. To analyze relationship between sales and profit, you need to look at margin. A huge sales is obsolete to investors unless company can retain its sales after expenses and hand it down to investors' pockets. One other thing Fisher discusses is a positive cash flow. This mean profits must be realized soon enough to be useful. Opportunity or risk sometime arises without showing any of it. If it ever happens a company with positive cash flow who realizes its profits sooner than its competitors, is more likely to seize the opportunity or prevent the risk from occurring because all it can simply use the reserved cash to expand or pay unexpected expenses. In addition, Fisher mentions an importance of low cost operation. If management can cut down cost of sales, it will have lower break-even point and a higher profit margin. This corresponds to Graham's margin of safety.
In order to be a successful investor, Fisher advises people to concentrate on industries that they already know. This is also known as "circle of competence." For instance, if your interest is in automobile and have much knowledge regarding car and related products, your starting point in investment would be evaluation of auto companies like Ford, GM, Chevy, etc. The best source of information is individual who are related to the company such as customers, suppliers, employees, competitors and industry associations.
Research and analysis are time consuming. Especially for individual investors who have limited resources face difficulty digesting millions of information and trying use them in analysis. Fisher recommends a focused portfolio, where you put most of your capital into a few strong companies. Note that this can be quite risky though. Later on, we will discuss diversification and how risks can be spread among various stocks while keeping desirable returns. The point Fisher makes is that a few superior companies are better than a bunch of mediocre ones.
H-1B visa update
The most recent H-1B visa update was on August 6, 2010. It can be read at:
As of August 6, 2010, U.S. Citizenship and Immigration Services (USCIS) reports that approximately 28,500 H-1B cap-subject petitions out of 65,000 visas available, and approximately 11,900 petitions qualifying for the advanced degree cap exemption out of 20,000 visas available have been filed.
USCIS will continue to accept both cap-subject petitions and advanced degree petitions until a sufficient number of H-1B petitions have been received to reach the statutory limits.
Last year at this time, approximately 44,900 H-1B cap-subject petitions and approximately 20,000 petitions qualifying for the advanced degree cap exemption had been filed.
For the second time in several years, it is likely that USCIS will still accept H-1B petitions on the start date of the 2011 U.S. federal fiscal year, which is October 1, 2010. The economic downturn and new procedures for processing H-1B petitions continue to have a significant effect on H-1B processing.
Friday, August 13, 2010
The intelligent investor
Benjamin Graham is the author of "The Intelligent Investor," which is one of the most influential investment books written. He is considered to be the father of value investing and his book tells value-oriented investment strategies. The book is consisted of few hundred pages but let us be concise and go straight to the points. Here are the main points of Graham.
1. Market is volatile and nobody can perfectly predicts its behavior. This is quite obvious. Even with careful examination of past movement and statistical analysis, it is not possible to perfectly forecast future market condition.
2. General public is usually wrong. People are emotional and market demand/supply fluctuate based on public psychology. However, market will come to an equilibrium over time. So as an individual investor, your job is to automate parts of your investment strategies. Once standards are formed, you will not be hop in and out of market like a frog following other investors. But rather, your profit/loss will be solely based on your own strategies and rules.
3. Every stock has business and market valuation. The business valuation is the stock's book value, which is a value you get when the company is liquidated. In addition, it is significant that you also take earnings into consideration when valuing business. You need to look at what the company is worth right now in term of book accounting but it is equally important to analyze future prospect and potential profits of a company. The market valuation is trading price of stock in market. After the stock valuation, you will approximate its intrinsic value, if that number is greater than the market price then the stock is undervalued. If market price is greater than the intrinsic value then the stock is overvalued.
Graham recommends investors to purchase stock near its intrinsic value. This means P/B being close to 1, preferably lower than 1, which means that stock is on sales.
4. Graham also advise investor to carefully examine growth potential of company. One can do so by analyzing financial position of a company and its earning growth rate. P/E below 15 is a good sign.
5. Market will fluctuate and reach equilibrium. Once you set your strategies, your job is to buy low and sell high. Sometimes, market will bring down the price of your stock for no apparent reasons. But it is important that you stick with your decision. If the stock you chosen is truly undervalued, market will adjust itself over time and bring the stock price back to what it should be. Hence, don't get nervous and let your stock ride along the wave.
6. Margin of safety is difference between the business valuation (intrinsic value) and market valuation. For a simple example, if IV =$20 and MV = $15 then margin of safety = $5. This means you have at least $5 buffer to withstand when the market fluctuate and your stock price declines. Since you believe that stock is worth $20 and bought it at $15, you saved yourself $5. So until the stock plummets to $10, you are not having a loss. The margin of safety comes from both quantitative and qualitative factors. Good management team can be considered margin of safety but then again unmeasurable factors are not good elements in analysis. Something unquantifiable is too vague, especially when your financial resource is scarce you do not want to rely on such factors. Graham put special emphasis on the financial health of company. Long term debt is a bad sign and possible insolvency problem.
Key point of "The intelligent investor" is to make wise investment based on careful analysis and pay a fair price for a stock regardless its future prospect. By doing so, you minimize the risk and become a victim of market fluctuation.
Thursday, August 12, 2010
Stock measurement
There are some common stock measurements that many individual investors use. You will not have to calculate most of them as they are available on newspaper, magazine and online. Of course, you can compute your own measurement by using data from financial statement of a company. Note that measurements of different publications sometimes do not match as they differ in reading and analyzing financial statement. So P/CF from Yahoo finance may not be the same as that of Google finance. Moreover, it is important to realize that stock measurements do not necessarily guarantee a good investment. Even if all your stock measurements give a green light, the stock may end up being a loss.
One of the common stock measurements is cash flow per share (CF/share). The idea is simple: Cash is always good. Cash flow is a stream of cash coming in and out of business. You will prefer it to be positive. Many businesses sell their goods/services on credit and most likely, those companies will report their financial statement based on accrual accounting. This means that a company will book its revenue on account receivable although cash has not been exchanged (or flowed in from company perspective). This is not necessarily bad or good thing as there are pros and cons for accrual/cash based accounting. One negative aspect of this method is if there are defaults, those receivables will be written off as bad debts. That is where CF/share kicks in as an important factor. Because if you solely rely on sales/earning based on financial statement, it can mislead you. Especially, earning is a subject to manipulation. In such case, a plenty of cash is very handy. If some unexpected events occur causing an expense, those cash comes in handy. In similarity, if there is a good opportunity to expand its business, cash can be very helpful. For instance, if a company A wants to acquire company B and B agrees to sell itself then A will have to come up with a bunch of payment options. It could be cash+stock. There is a plenty of reasons to reject it but cash only is a safe deal. CF/share is simply a company's cash flow divided by the number of shares outstanding. What it shows is the price you are paying for a share of the company's cash flow.
Current ratio is one of the key measurement to find a company's financial health. It reveals the company's ability to pay its short-term debts. Current ratio = Current Asset / Current Liabilities. For example, if company's CA is $4M and CL is $2M then current ratio will be 2 to 1. Current assets are company's assets that are used up and replenished frequently such as cash, inventory and account receivable. Current liabilities are liabilities that are due within one year or a business cycle. If current ratio is too small, a company might have hard time facing unexpected to expense, which can lead the company to insolvency problem. Note that it does not necessarily mean better when a company has higher current ratio. It is important that a company has enough assets and cash to meet its debt obligation but it is as much important to wisely utilize their assets and cash to increase the future earnings.
Dividend yield is company's annual cash dividend divided by current stock price. For instance, if a company's annual dividend is $1 and its stock price is $25 then DY= 1/25 = 4%. This measurement tells whether the price you are paying is overvalued or not. For most companies, dividends remain constant over time. If there is a change in DY, it is most likely because of stock price change. If DY declines, that means denominator the stock price increased. As mentioned in the previous posting, investor can profit off the stock from dividends and capital appreciation. As an owner/shareholder of company, you share the profit of a company in form of dividend, If DY is too low, the stock may be overvalued.
Earning per share (EPS) is most commonly used measure for growth investors. EPS = Earning / number of shares outstanding. For instance, if a company earned $100,000 and the number of shares outstanding is 10,000 then EPS is 10. This number is quite big. Generally, EPS will fall within 1-5. It can also be negative if a company experiences loss. Obviously, stock is more attrack if EPS is high. But for growth investor, what is more important is probably EPS growth rate. If a company has higher EPS quarter after quarter or year after year, company is having earnings momentum. This is one of the ways to discover growing company. In addition, growth investor also pays attention to earning surprise, which is quarterly report from a company showing either higher or lower EPS than expected. Positive surprise usually causes a sharp increase in stock price whereas negative surprise does opposite.
Net profit margin (NPM) is another measure to evaluate a company's performance and how management does well on cutting expenses and keep most of its revenue. NPM = Net income / Sales. For instance, if net income = $100,000 and sales = $1M then NPM = 10%. Indeed, sales volume and total earnings are very importact factor in financial analysis. But at the same time, margin is equally important because it shows management ability to control business cost. If company A and B make the same sales but B keeps more of its sales than the A does, it is obvious that B is superior to A and should be a better investment (all other things being equal).
Price to Book ratio (P/B) compares a stock's market price to company's book value. P/B = Ps/Pb or total MV / total BV. Book value is the dollar value you get when a company is liquadated. For instance, if a company fails and sell all its factories, equipments, inventory then it gets $500,000. That is the total book value of a company. Say there are 100,000 shares of stock oustanding, then Pb=$5. If Ps = $5 then P/B = 1. This means even if a company goes bankrupt, investor will be able recoup his initial investment. So if P/B is less than 1, you can say stock is undervalued and purchase it since you have nothing to lose. Actually, you have a "margin of safety" in this case. Since price you are paying for is lower than the book value, you have some buffer to withstand when the stock price goes down until P/B hits 1. Note that P/B is more suitable risk-aversive investor because it measures market price in relation to liquadation value, which is probably the most worst scenario for all the companies out there. Note that book value does not accomodate intangible assets such as brand power and good will. Think about Coca Cola or McDonald. The values of those brand go beyond their equipments, factories, and any tangible assets.
Price to earning ratio (P/E) = Ps/EPS or Total MV / Total earning. This is the number one measure of value investors. If price of stock = $100 and EPS =5 then P/E = 20. This means you are paying $20 for every dollar earned by a company. Trailing P/E uses earnings from last 12 months whereas forward P.E uses next year's projected earnings. Generally, companies with low P/E usually operate in slow-growth or matured industry. Most young companies have high P/E over 20.
Price to sales (P/S) = total market value of stock / total sales or price of stock / sales per share. For instance, if a company's stock price = $50 and sales per share = 10 then P/S = 5. This means you are paying $5 for every dollar sale. If another company also has stock price = $50 and sales per share = 25 then P/S = 2. In other words, you are only paying $2 for every dollar sale. In this case, latter is a more bargain than the first one. Note that sales and earnings are not mutually exclusive. If you look at P/S then you should also pay attention P/E and EPS to make comparison among stocks.
Return on equity (ROE) is one significant measure. This shows the rate of return to sharesholders, which is ultimate measure of investment value. ROE = Net income / Total shareholders' equity. If NI = $1M and TE = 100,000 then ROE = 10%. Since ROE tells how much a company is making off the investments that shareholders provide, a larger % is always better.
Wednesday, August 11, 2010
Stock evaluation
There are numerous ways to evaluate stocks. Later in the future, we will cover several financial models to calculate intrinsic value of stock, which require you to read and analyze financial statements. But for now, let us examine basics to get the idea. In a broad perspective, there are two approaches to evaluate stock. One is called fundamental analysis and the other is technical. The difference between the two is not as obvious as there will be some overlaps and one thing performed in fundamental analysis can also be performed in technical. When it comes to investment, it can be classified into either "value" or "growth" investing. This is the most basic division between investors. One of the most well known investor, Benjamin Graham, is considered to be the father of value investing. On the other hand, there are plenty of great investors who made fortunes through growth investing, such as William O'Neil and Gary Pilgrim.
So what's the difference between the two? Growth investor looks for a company that is rapidly expanding in sales and earnings. Most likely, such companies are young and has a potential to become a "major stream" of industry in which the company operates. Such potential or growth may come from a new high-tech product, patent, oversea expansion, or even excellent management. Major components of growth investing are earning and stock price. On the contrary, dividend is not important because most growing companies will waive dividend and use the retained earning to expand its business. For growth investors, intrinsic value of stock is not important. This means you, as a growth investor, do not see the importance of stock price in relation to earning or book value. What is more important is earning growth and stock price momentum. In this case, buy low sell high is not your objective but rather it will be buy high and sell higher.
Value investing, on the other hand, look for stocks that are undervalued. In other words, you are looking for cheap/inexpensive stock. Note stock being cheap is not good enough. Even if a share of stock is trading at $1, it would be worthless if the company is on the verge of breaking-down. What I mean by cheap is undervalued stock in comparison with its market value. Value investing compares stock price (market value) to different measures of business such as earnings, sales, assets and cash flow (intrinsic value). Most of times, value investing require investor to carefully examine financial statements and compute intrinsic value of a company. Then one can determine whether the stock is under or overvalued. In both cases, investor looks for companies with bright prospect.
As mentioned, there are two approaches to evaluate stock. One is fundamental and the other is technical. In the fundamental approach, investor examines company information and evaluate its future success. Here, you will have to pay attention to financial statement including income statement, balance sheet, cash flow and other company released documents such as management note, company related news, etc. In contrary, technical analysis examines the past movement of stock price to predict its future behavior. Here you will analyze how the stock price moved in different market condition (bull/bear) and predict the stock's future movement based on current and projected market condition. It will require lots of charts and graphs to figure out pattern of stock price movement. The catch is that technical analysis focus on market demand and supply rather than intrinsic value of stock.
Stock Splits
A stock split occurs when a company increases the number of its stock shares without increasing the total value of equity. This means that you will own a larger number of shares but the total value of investment remains the same. For instance, let's say you have 100 shares of a stock trading at $100. Then your total investment value is $10000. If the stock splits 2 for 1, you will own 200 shares of stock trading at $50. Still, your total invest is worth $10000. What's the catch here? Mathematically, stock split does not affect the value of stock and is completely irrelevant to investors. However, stock splits tends to occur when a company has done well and expect to continue in the future. From the company perspective, a point of stock split is to make its shares available to more investors. If you are investing on a budget, you might hesitate to invest in stock trading at $100 but $50 may sound affordable. Through the stock split, a company can gather more capital and make its stock shares more active in market. Stock splits were very common in the 1990s during the bull market. IMB split twice while Oracle split five times. Microsoft split seven times and Cisco split eight times. One thing that you must note in stock split is the lowered price of stock. Initially, stock split itself does not have impact on the value of stock but it will affect the price movement. Generally, lowered priced stock tends to move quicker than the higher priced ones. In addition, fluctuation or dollar movements of lowered priced stock has a greater % impact on return. For instance $5 increase is a 10 % gain for a $50 stock whereas it is only a 5 % gain for a $100 stock.
Tuesday, August 10, 2010
Asset classes and financial instruments
As mentioned in previous post, there are many different types of investments. They are traded on various markets and distinct natures of each type must be considered when you invest. Hence, investor needs to think about his/her investment goal/objective in order to make proper investments and wisely use their resources.
Major Classes of Financial Assets or Securities include,
Money market
Bond market
Equity markets
Indexes
Derivative markets
In this blog, I will solely focus on equity markets, covering basics of stock.
To briefly go over each market, let us take a look at the money market first.
Money Market Instruments include but are not limited to,
Treasury bills
Certificates of deposits
Commercial Paper
Bankers Acceptances
Eurodollars
Repurchase Agreements (RPs) and Reverse RPs
Brokers’ Calls
Federal Funds
LIBOR Market
Money market instruments are generally considered low risk; hence their returns are low accordingly. They provide liquidity to companies and can be good investment option for those who are risk-aversive.
Here's the chart illustrating rates on money market.

Generally, a bond is a promise to repay the principal along with interest (coupons) on a specified date (maturity).
Bond Market includes but are not limited to,
Treasury Notes and Bonds
Federal Agency Debt
International Bonds
Inflation-Protected Bonds
Municipal Bonds
Corporate Bonds
Mortgages and Mortgage-Backed Securities
Maturities for bonds:
Notes – maturities up to 10 years
Bonds – maturities in excess of 10 years
Par Value - $1,000
Quotes – percentage of par
The picture below shows the list of treasury issues.

Municipal bonds are the ones issued by state and local government. They can be classified into general obligation and revenue bonds Their maturities range up to 30 years. Interest income on municipal bonds is not subject to federal and sometimes state and local tax. To compare yields on taxable securities, a Taxable Equivalent Yield is constructed.
Corporate bonds are issued by private firms. Most likely, they pay semi-annual interest payments and are subject to larger default risk than government securities. Some of the options in corp bonds are callable and convertible. The chart below shows the investment grade bond list.

Mortgages and Mortgage-backed Securities are developed in the 1970s to help liquidity of financial institutions. Investors have proportional ownership of a pool or a specified obligation secured by a pool. The market has experienced very high rates of growth and has been a hot issue past few years during the financial crisis.
Equity Markets include,
Common stock, which is a residual claim and has limited liability.
Preferred stock, which has fixed dividends and priority over common stock.
Stocks are traded on the markets such as NYSE, AMEX and NASDAQ.
Stock market indexes represent the stocks in the market and show their movement as well as their returns.
There are several indexes worldwide such as Dow Jones Industrial Average (DJIA) and Nikkei average of Japan. They offer ways to compare performance. Several factors must be taken into account when constructing stock indexes. Some of the questions that must be answered are: Are the representative? Broad or narrow? How is it weighted?
Stock indexes can be weighted in various ways. For instance, DJIA is price weighted whereas SP 500 and NASDAQ are market weighted. Let's look at the data below to compute price weighted average.

Using data from Table
Initial value = $25 + $100 = $125
Final value = $30 + $ 90 = $120
Percentage change in portfolio value =
Initial index value = (25 + 100)/2 = 62.5
Final index value = (30 + 90)/2 = 60
Percentage change in index =
-2.5/62.5 = -.04 = -4%
Using data from Table, ABC would have five times the weight given to XYZ.
Graph below shows the comparative performance of different market indexes.

Stock return
Here's the bottom line of stock investment. How do you make profit off the stocks?
There are basically two ways. One: Through the dividends. Second: Through the capital appreciation.
When you own a share of stock, you are partial owner of the company and you might share some of the company's profits in form of dividend. Companies report their earnings every quarters and decide whether to pay a dividends or not. Small companies, which is still growing, would not pay dividends most likely. Instead, they will use the retained earning to keep the company grow via investing in project, buying more equipments, hiring more skilled workers, etc. Bigger companies, which are more financially stable and have less room to grow, will return some of their profits back to investors in dividends. To receive a dividend, you must own the stock by the ex-dividend date, which is four business days before the company looks at the list of shareholders to see who gets the dividends. Note that most publications report a company's annual dividend, not the quarterly. In addition to dividend, investor profits off the capital appreciation. The capital appreciation is profit that you earn after buying stock and selling it at a higher price. Buy low and sell high is a basic paradigm of stock investment but buy high and sell higher is as legitimate.
So the total return of stock investment would be, (P1-P0+D1)/P0.
P1 is selling price of stock whereas P0 is purchasing price and D1 is the dividend you received.
If dividend has not paid, then total return would be simply, (P1-P0)/P0.
For instance,
Ending Price = 24
Beginning Price = 20
Dividend = 1
HPR = ( 24 - 20 + 1 )/ ( 20) = 25%
Basics of stock trading
Let us cover the basics of stock trading.
When stocks are bought and sold, it's called "trading." When a person says MSFT is trading at $40, that means Microsoft stock is selling at $40 and you will have to pay $40 to buy a share of MSFT stock. Every company listed on the stock market has a ticker symbol, which is the unique code used to identify its stock. For example, IBM is IBM on New York Stock Exchange and Microsoft is MSFT on NASDAQ.
A $1 move in stock price is called a "point." For instance, if MSFT move from $40 to $45, then you'd say it increased 5 points. Commonly, individual investors purchase stocks in block of 100, which is called a "round lot." This facilitate investors to control their stocks and monitor their profits/loss because a one point move up/down adds or subtract $100 from the value of his/her investment.
There are two types of stocks. First type is preferred and the other one is common. Both represent equity/ownership in a company. Basic characteristic of preferred stock is that it has a fixed dividend that does not fluctuate, Those who own the preferred stock receive their dividends before common stock holders. Because of its nature, preferred stocks can be thought of as a bond. It is more similar to liability than the equity. Thus, when the company fails and is liquidated, preferred stock holders are paid before common stock holders. Common stock is what most of individual investors own. Common stocks are available for trading on the market. When you buy a share of common stock, it entitles you to voting right and dividends will fluctuate based on profit/loss of the company.
Monday, August 9, 2010
Most Recent H-1B Visa Cap Count
The most recent H-1B visa update was on July 30, 2010. It can be read at:
www.uscis.gov/h-1b_count
As of July 30, 2010, U.S. Citizenship and Immigration Services (USCIS) reports that approximately 27,300 H-1B cap-subject petitions out of 65,000 visas available, and approximately 11,600 petitions qualifying for the advanced degree cap exemption out of 20,000 visas available have been filed.
What is stock or equity?
According to the dictionary definition, stocks are capital paid into or invested in the business by its founders. For exmaple, if you wish to found your own company to sell newspapers, you will have to gather investors, who will inject capital into your company so that you can start to buy equipments, rent office, hire employees, etc. Those people, who buy shares of stocks, are the owners of the company. So what's the difference between stock and equity? Equity in finance refers to the value of an ownership interest in property, including shareholders' equity in a business. In other words, equity means claim on ownership. Stock can be classified into equity but equity does not neccessarily mean stock. For example, equity can be home equity, which is the difference between the fair market value and unpaid mortgage balance on a home. Now that you know what the stock is, let us look at the reasons why you should invest in stock. There are quite a number of financial securities out there including but are not limited to bonds, stocks, derivatives, treasury bills/notes and real estates. All those various fiancial securities have unique characters, which require careful examination of each investment class. Here in this blog, I will soley focus on stocks, which I think is the best investment out there. The reasons are simple. First, stocks have been the best performer over the decades. Let us look at the hard numbers and see what the statistical data tells us. The stock market has returned approximately 10.5 % in comparison with corporate bond's 4.5 %. More over, U.S. treasury returned 3.3 % while inflation also grew at around 3.3 %. So that means if you invested in treasuries, you got nothing after the inflation. Second reason is that investment in stock wiill give you further insight onto derivatives and other complex financial instruements. Although derivatives such as options, futures and swaps require in-depth analysis, they can be used to speculate, which will give higher return than stock. But more importantly, they can be used to hedge. Note that hedging does not mean reduction in risk. Rather it aligns the level of risk with your risk tolerance. In addition to that, there are theoritic artibrage opportunites, which can be exploited to gain risk-free return. All those derivatives will be explored later on this blog. However, let us focus on stocks for now.
Subscribe to:
Posts (Atom)