Scenario Analysis and Probability Distributions
In order to examine risk, we can look at the risk/uncertainty using probability. Here 3 important variables that you need to know before moving on the analysis.
1) Mean: most likely value
2) Variance or standard deviation
3) Skewness

In probability theory and statistics, skewness is a measure of the asymmetry of the probability distribution of a real-valued random variable. skewness value can be positive or negative, or even undefined. Qualitatively, a negative skew indicates that the tail on the left side of probability density function is longer than the right side and the bulk of the values (including the median) lie to the right of the mean. A positive skew indicates that the tail on the right side is longer than the left side and the bulk of the values lie to the left of the mean.


Measuring Mean: Scenario or Subjective Returns

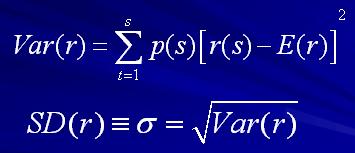
p(s) = probability of a state
r(s) = return if a state occurs
1 to s states
This is a formula to calculate expected return (subjective/scenario return), which is equals to multiplication of each state's probability (in decimal) and return. After you get each value, sum them up to get final E(r) value.
Numerical Example: Subjective or Scenario Distributions
State Prob. of State rin State
1 .1 -.05
2 .2 .05
3 .4 .15
4 .2 .25
5 .1 .35
E(r) = (.1)(-.05) + (.2)(.05)...+ (.1)(.35)
E(r) = .15 or 15%
Measuring Variance or Dispersion of Returns
Variance is used as one of several descriptors of a distribution. It describes how far values lie from the mean.
Using the same example above,
Var =[(.1)(-.05-.15)2+(.2)(.05- .15)2...+ .1(.35-.15)2]
Var= .01199
S.D.= [ .01199] 1/2 = .1095 or 10.95%
No comments:
Post a Comment